5 min read
The Power of Visualization in Freight Optimization and Resilience
Kelly Barner : Updated on December 1, 2024

Anyone who spends their day working with data will tell you that data alone is never enough. It needs to be standardized, contextualized, and presented in a way that allows it to drive consensus towards a given objective.
That idea holds true for a company called Routescanner, based in the port city of Rotterdam. As much as data is a key element of what they do, the real goal is to change how decisions are made based on that data.
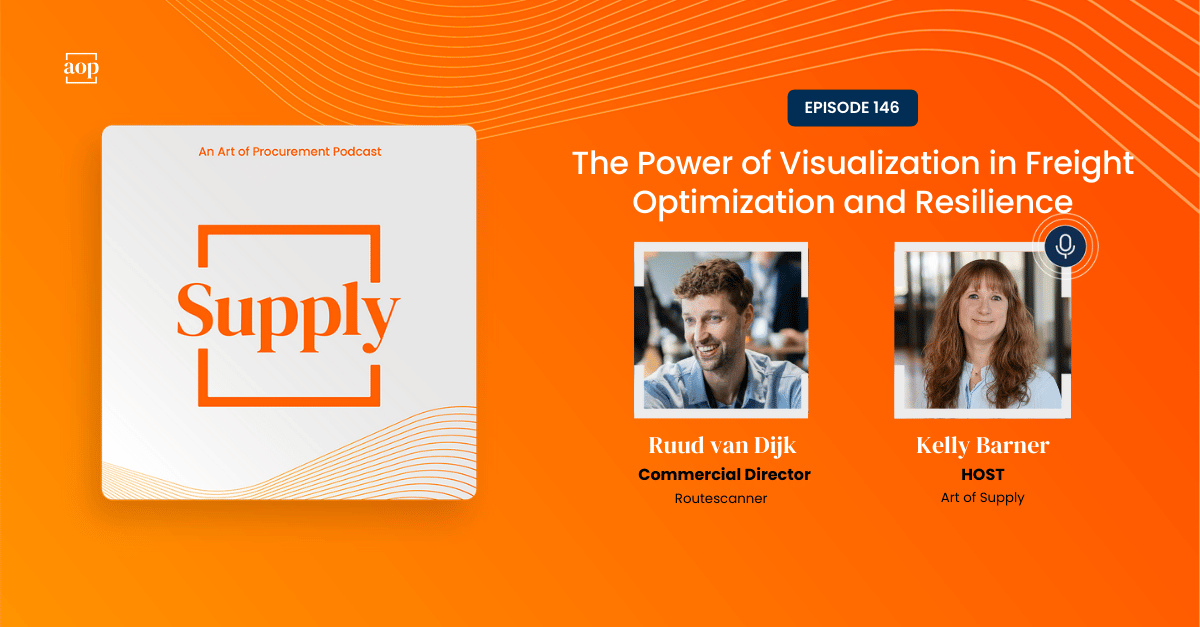
To learn more about data driven decision making for worldwide container transport, I recently spoke with Ruud van Dijk, Routescanner’s Commercial Director. He has a background in innovation and is an avid reader, so I knew I was in for a great conversation.
Making Data Actionable
Decision makers have access to massive amounts of data, often enough to cause ‘analysis paralysis,’ or the feeling that the data is so overwhelming that it is practically useless. This is especially likely when teams are trying to make decisions quickly in response to changing conditions. If you can’t evaluate all of the options, you might as well review none of them.
Because his team is focused on scheduling data, they are less concerned with real-time information and more concerned with precise decision-making windows. Once a container starts a leg of its journey, whether over the sea or via rail or truck, it is very hard to make a change. As a result, those slim decision opportunities are consequential for the companies making them.
“It’s really about allowing you to, before you actually put a booking in, to really understand, am I making the right decisions? On a strategic level, can I do things differently?” Ruud told me.
Given the nature of these optimization scenarios, I was curious to learn how companies make these decisions without the support of a digital platform. In Ruud’s answer, I found an old friend: spreadsheets. Despite the inherent complexity, many companies turn to manual methods to support their decision making.
Ruud shared an example of how this usually plays out:
“One of our clients described what they will often do to understand the connectivity of locations. They will start on Google Maps, identifying terminals around a certain location and going to these terminals, understanding how these terminals are connected, then looking at how these ports are connected. So it’s a lot of manual work, going through the steps yourself and a lot of phone calls, going to portals from the different carriers.
“They don’t have their schedules in a single source, so they need to get it from different sources. Especially if you have a crisis happening or an emergency, this becomes a real issue because then the whole team is in chaos and needs to email, call, compare data, but the data is not standardized.”
Just as data needs context to be actionable, human success is subject to the conditions decisions are made in.
Old Habits Die Hard
Even in complex situations, humans remain creatures of habit – we like doing things the way we’ve always done them – and that makes it hard to turn data into opportunity.
“We’ve done it like this before. It’s working okay or good enough. So why do it slightly different now? It works fine or good enough,” Ruud often hears companies say.
The major issue with this logic is that people have not experienced the alternative, where data is available in one place, allowing them to skip to option consideration instead of spending precious hours gathering and normalizing information.
In some ways, higher pressure situations drive us to comfortable methods. Manual processes may even create the illusion of increased control. But in that state, very few people are positioned to make optimal decisions, even if they do have all of the information in front of them (which they probably don’t).
“We need to know what lanes you are operating, and these lanes are all put into the system. Our system will automatically look for alternative routes based on the benchmark you provided, “ Ruud explained. “We take into account your settings, your parameters. If you have preferred carriers, preferred suppliers, we can take that into account. If you have preferred ports or terminals that you solely want to ship your cargo via, we can take it into account.”
Every company, and potentially every container, is different, but the decision making process for their shipping schedule and route is not. The options and contextual information are known and often fixed. The advantage lies in comparing as many options as possible before making a final decision.
That doesn’t mean adjusting to a new way of thought is easy. When Ruud spoke about showing a company their lanes visually displayed for the first time, it brought back memories of showing a procurement team their spend data in a cube for the first time. Even having the information presented in a more digestible format was so foreign that more than once, I had a team insist I was showing them someone else’s data. Over time, however, having a richer alternate view is what changes the thought process.
“I think this is one of the things for us that really stands out, people love seeing the visual part. That’s what our clients love,” Ruud told me. “Seeing the routes visually presented, but also seeing the alternatives visually presented against what they’re doing today helps a ton. It’s also about the effectiveness of it and being able to share it easily. This is really for us where we are standing out.”
We all learn and think differently, but data visualization is a valuable exercise. Taking data out of spreadsheets and bringing it to life can often introduce entirely new approaches.
Multi-modal and Multi-objective
If seeing data and the impact of business decisions creatively triggers people’s brains, the same is likely true for fostering conversations beyond supply chain.
“One of the roles we also aim to facilitate is collaboration with teams between departments,” Ruud explained. “Logistics and supply chain is really about the whole organization, right? Especially with topics like sustainability becoming ever more and more present.
“Being able to take this into account at a glance, but also from a sustainability team or sustainability department perspective, empowers them because sustainability is often perceived as a cost. […] Tools like this really help you also visualize how without impacting your lead times, without impacting your costs, you can still do something about sustainability.”
If data can be a barrier for creativity and decision making within supply chain, it can do the same for cross functional conversations as well. Moving data into the visual realm can open doors to input from other groups and about other business objectives.
“Connecting departments, connecting different teams to have these types of conversations together that they were not able to have without this sort of visual appearance is really, I think, a game changer,” Ruud said. “When you’re a forwarder, it’s more about the conversation with your clients. You can start having a different conversation with your client about what if we would reroute in this way? Yes, it will maybe impact your lead time to some extent, but we will be able to reduce your emissions quite significantly. Is that an option? And again, even if it’s a no, it’s about having the conversation.”
Global Routes Towards Sustainability
Given that reducing emissions is one of the key business objectives achieved through the supply chain, it was a natural part of the conversation Ruud and I had about decision making. Each country and region has different regulations, expectations, and priorities when it comes to sustainability, but when we talk about supply chains, the focus is naturally global.
I asked Ruud about the current sustainability focus of the companies he and his team are having with clients.
“I think the biggest, most recent change that they see is a regulation about reporting your emissions. That is taking effect on the 1st of January 2025, but you have to report your emissions based on 2024. And that starts out with the largest companies,” Ruud answered.
“Not only will you have to report on what your emissions are, you also have to start coming up with strategies that also will be validated and checked to reduce your emissions. And that is one of the places where we also want to play a role.”
As Ruud went on to explain, surcharges will be issued per container per ton of emissions – and the cost of those surcharges is expected to increase in the years ahead. Instead of moving towards sustainability being seen as an added cost, not doing so will be viewed as an added liability.
There will always be new factors and constraints to include in the decision making process, and more data too. These decisions will get more complicated to make, especially without digital support, and the windows of time for making those decisions in will likely decrease.
Now is the time to understand how we make decisions, how trustworthy our data is, and how easily it can be kept up to date. Spreadsheets just don’t cut it anymore.


