

The AOP Buyer Power Score is a content offering created in partnership with ProcurementIQ that rates the balance of power between buyers and sellers for a particular spend category
Today we are reviewing Trade Show Displays.
The Numbers
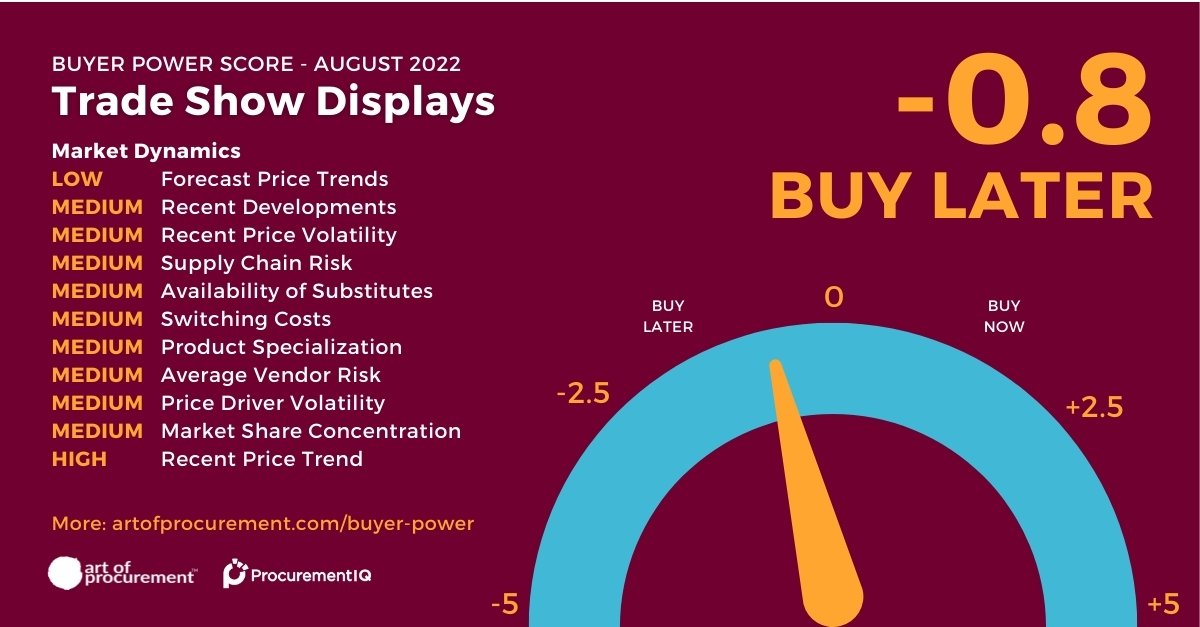
The Buyer Power Score for trade show displays is -0.8 on a scale of -5 to 5, with -5 signifying low buyer power and 5 meaning high buyer power. The more power a buyer has the greater leverage they have to get lower prices and better contract terms.
The whole conference/convention industry was shaken up by disruptions to business and business travel in 2020 and 2021. Many exhibitors and show hosts made the decision to take their events virtual or make them smaller and host hybrid events.
Buyers are expected to lose negotiating leverage in 2023, making this the time to negotiate prices for planned display purchases.
How to Use this Information
This report covers trade show displays, a product provided by event management companies, sign production companies and trade show display specialists. Suppliers in this market sell pop-up displays, banner stands, flat-panel displays, and tabletop displays.
While it is forecasted that the incorporation of virtual live streaming will double in the future, some parts of the United States are investing in in-person facilities. For example, Dallas, Texas recently approved a new 2.5 million square foot convention center. This is expected to increase demand for trade show displays as companies compete for advertisement space within the newly constructed building.
Dig Deeper
We have partnered with ProcurementIQ to dig into their treasure trove of over 1,000 indirect category intelligence reports, with new insights every Friday. To dig deeper into the Trade Show Displays report, click here.